LogLoader()
Loads REIXS Experiment Logbook
Class Information
Python
## CREATING A REIXS BEAMLINE LOGBOOK ##
Log = LogLoader()

## LOADING A LOG BOOK ##
Log.load(config,'filename',logbook, **kwargs)

# REQUIRED VARIABLES ##
## config = RIXS -> RIXS Endstation
## config = RSXS -> RSXS Endstation
## logbook = rixs_log -> RIXS Endstation
## logbook = rsxs_log -> RSXS Endstation
## filename = hdf5 filename -> extenstion not required

## **kwargs ##
## ncols = ['Title1', 'Title2', ..., 'TitleN'] -> Remove columns, key by Titles

## ADDING ADDITION COMMENTS OR DATA ##
Log.append('column', scan, 'text')

## REQUIURED VARIABLES ##
## column -> The title of logbook column to be appended
## scan -> The scan number to be appended
## text -> Text to be appended

## CHANGING VALUES OF ENTRIES ##
Log.replace('column', scan, 'text')

## REQUIURED VARIABLES ##
## column -> The title of logbook column to be changed
## scan -> The scan number to be changed
## text -> Text to be changed

## FILTERING LOG ENTRIES ##
Log.filter('column', 'value')

## REQUIRED VARIABLES ##
## column -> The title of logbook column to be filtered
## value -> Include condition to sort on, can be !, >, <. '==' is implied

## DISPLAYING A LOG BOOK ##
Log.show(**kwargs)

## **kwargs ##
## scans = [start] -> Starts the current logbook from the scan specified
## scans = [min,max] -> Reduces the displayed scans in the log book to this range

## EXPORTING LOG BOOK AS CSV FILE ##
Log.export('filename')

## REQUIRED VARIABLES ##
## filename =  filename to be used for ASCII file, do not add extension
Examples
Python
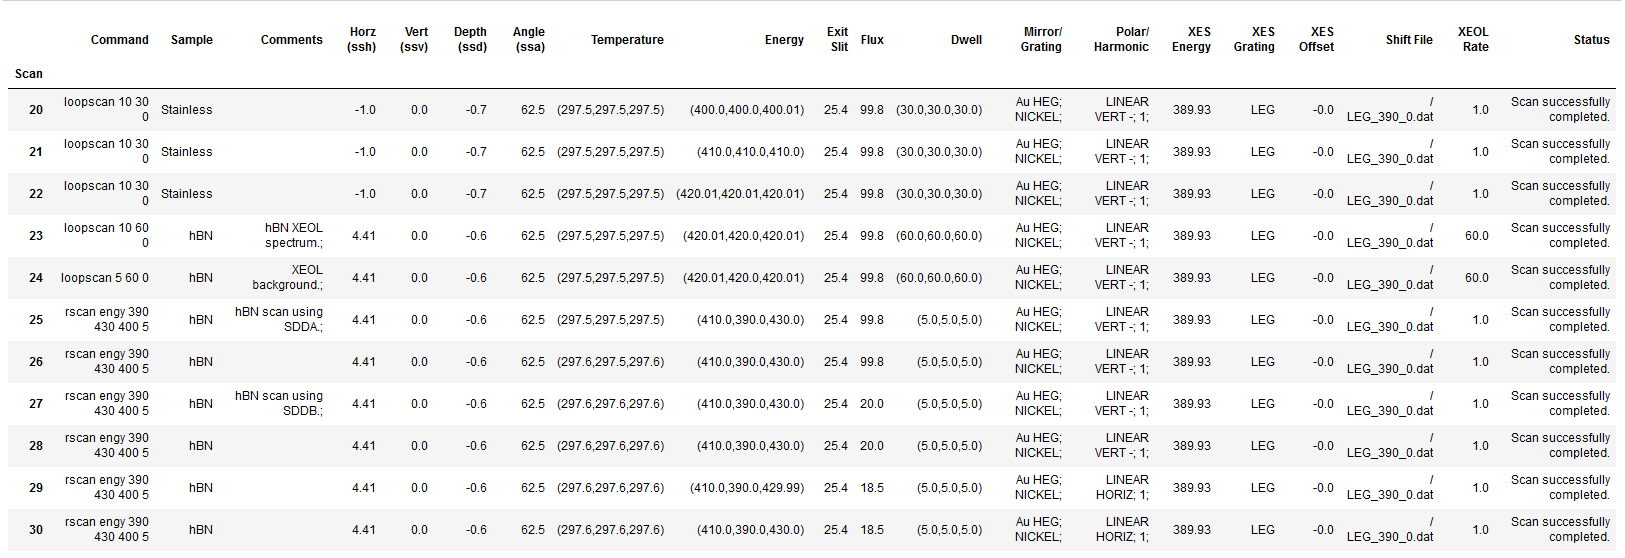
## Basical implimentation of logbook
## Display scans 20 to 30, remove Date column
Log = LogLoader()
Log.load(RIXS, 'HDF5_Notebook', rixs_log, ncols = ['Date'])
Log.show(scans = [20,30])
Log.export('Test_log')
Python
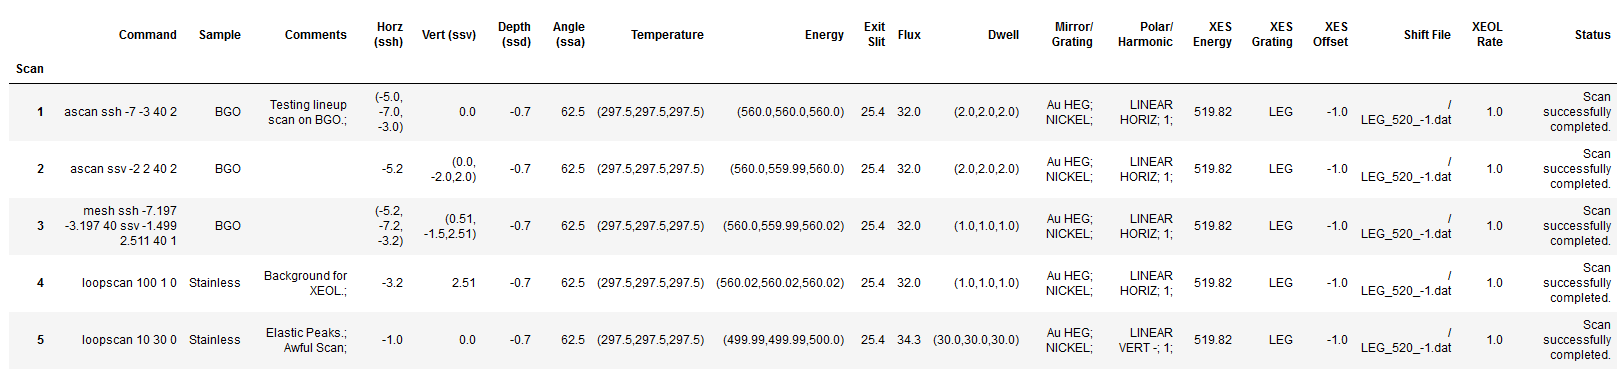
## Displaying log entries from Scan 1 to 5
## Modifying and appending data to the logbook
Log = LogLoader()
Log.load(RIXS, 'HDF5_Notebook', rixs_log, ncols = ['Date'])
Log.append('Comments', 5, 'Awful Scan;')
Log.replace('Sample', 4, 'Stainless')
Log.show(scans = [1,5])
Log.export('Test_log2')
BeamlineLoader()
Loads REIXS Metadata
Class Information
Python
## CREATING A BEAMLINE METADATA OBJECT ##
Beamline = BeamlineLoader()

## LOADING METADATA FROM A FILE##
Beamline.load(config,'filename','metadata', **kwargs)

## REQUIRED VARIABLES ##
## config = RIXS -> RIXS Endstation
## config = RSXS -> RSXS Endstation
## filename = hdf5 filename -> extenstion not required
## metadata = path to metadata -> consult documentation for HDF5 structure

## **kwargs ##
## norm = True -> Scales the data such that its range is 0 to 1.
## twin_y = True -> Adds these plots to a secondary scale
## yoffset = [(S1,P1),...,(SN,PN)] -> Adjusts y-axis scale to map SN to PN
## ycoffset = value -> Shifts y-axis scale by a constant value

## SET RANGE OF X OR Y VALUES ##
Beamline.xlim(min, max)
Beamline.ylim(min, max)
## NOTE: These ranges will be preserved in the data export

## PLOTTING METADATA ##
Beamline.plot(**kwargs)

## **kwargs ##
## title = 'New Title of plot' -> Replaces default title with user defined
## xlabel = 'x-axis label' -> Replaces default x-axis label with user defined
## ylabel = 'y-axis label' -> Replaces default y-axis label with user defined
## ylabel_right = 'right y-axis label' -> Replaces default right y-axis label with user defined
## plot_height = value -> The plot height in points, default is 600
## plot_width = value -> The plot width in points, default is 900
## NOTE: ALl bokeh kwargs are accepted.

## EXPORTING PLOT DATA ##
Beamline.export('filename', **kwargs)

## REQUIRED VARIABLES ##
## filename = filename to be used for ASCII file, do not add extension
## NOTE: Data is exported as it displayed, only options in plotting methods are ignored.

## **kwargs ##
## split_files = True -> Saves each data stream with number appended to the filename
Examples
Python
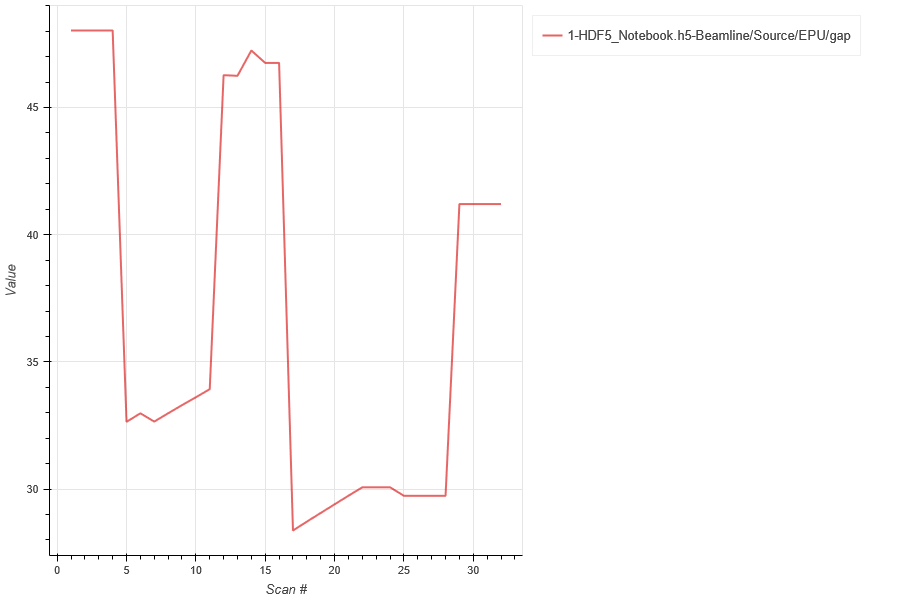
## Load the EPU gap
Beamline = BeamlineLoader()
Beamline.load(RIXS,'HDF5_Notebook','Beamline/Source/EPU/gap')
Beamline.plot()
Beamline.export('EPU_Gaps')
Python
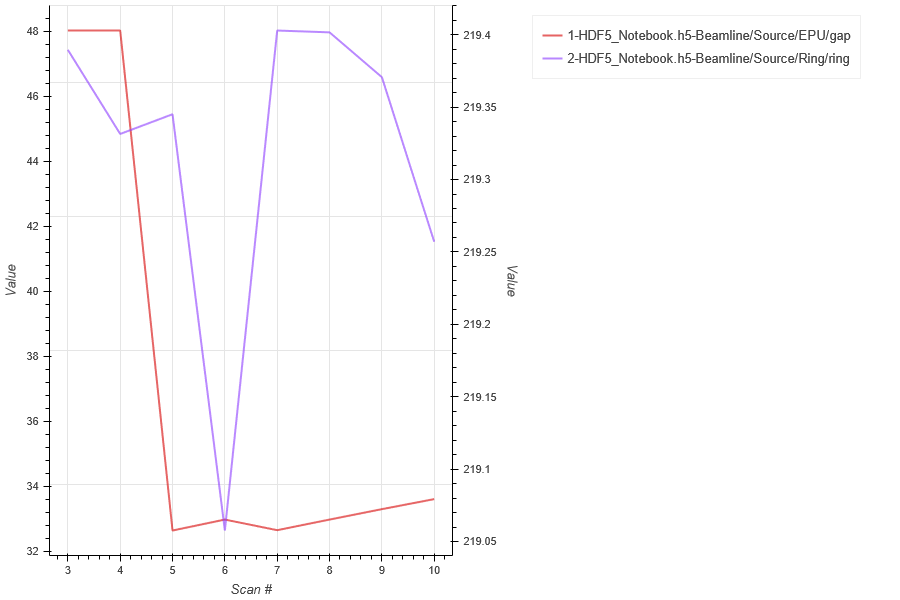
## Load the EPU gap, then load the storage ring current plotted on secondary scale
## Change to x-axis (scan range) to be between 3 to 10
Beamline = BeamlineLoader()
Beamline.load(RIXS,'HDF5_Notebook','Beamline/Source/EPU/gap')
Beamline.load(RIXS,'HDF5_Notebook','Beamline/Source/Ring/ring', twin_y = True)
Beamline.xlim(3,10)
Beamline.plot()
Beamline.export('EPU_Gaps_Ring')